SaaSculator part 4 – adding functionality
This is part of a series about building my side project SaaSculator. Each part covers my experiences and learnings while developing. The topics include the development, design, marketing & running of this project. You can find all parts here.
Model bindings & computed properties with Vue
The product
In the last post I converted the Figma design into HTML Code with Tailwind CSS. Now it’s time for Vue to start working its magic and breath some life into the site. The first step will be to make the inputs of the product card reactive and update the revenue when the amount or price changes. All of the inputs (including the name of the product) use Vues v-model attribute. The revenue is a straightforward computed property.

Below the product section is a button which lets you add more products. Because usually when people have SaaS products, they have more than one tier or product. Behind the scenes the button just adds a new item an array of products.
The table
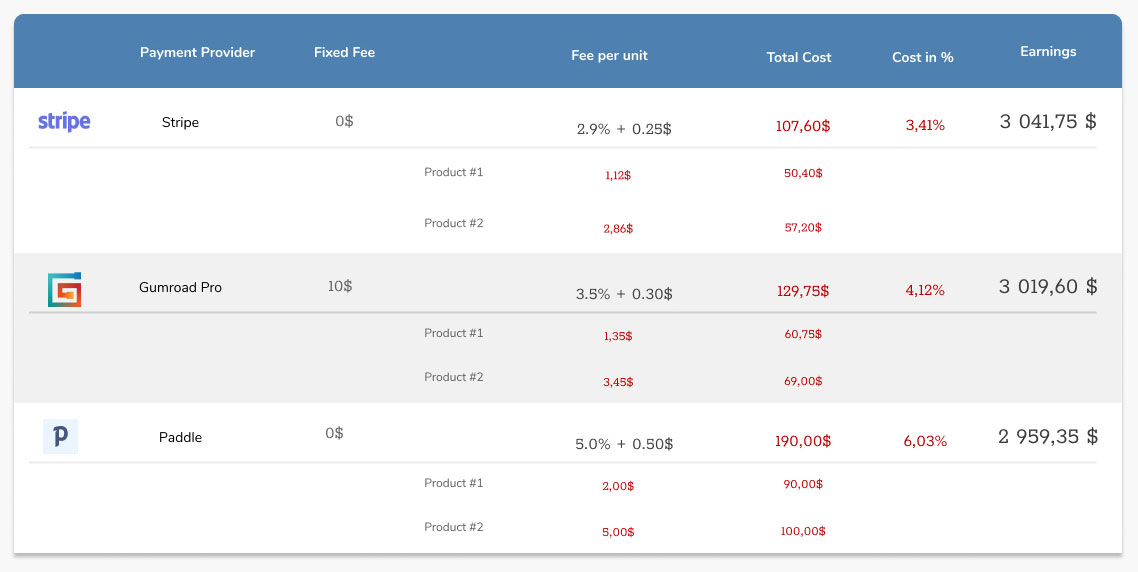
Up next is the table in which our providers are listed and the costs are calculated. Although some part of me is not happy to have a table with a ton of empty cells, it still feels like the semantically correct thing to use for this kind of information.
 The table is built by going over all of the providers and for each provider over all the products, adding new rows for providers and products with each iteration. For each provider it specifies the various fixed and variable costs, as well as how much profit you make with the provider. Below each provider row the products show a detailed breakdown of the costs per product. This is eventually going to bloat the table making it harder to scan and use, but that’s something to improve in the future.
The rows of the table are Vue components, which once again rely heavily on computed properties. As a result, they update instantly and give immediate feedback of everything you enter in the products input fields.
The header
Finally, the blue card on top needs to update the cheapest provider, when changes are made to the products. The total revenue just accumulates the revenue numbers of the products, whereas the cheapest provider statistic needs to retrieve the information from the providers within the table.
The basic functionality of the comparison table is now working, but there were already some potential issues which I need to address in the future. First, the state is currently distributed among the different components and not persisted in any way. So, when you refresh the page, your products are gone. Second the logos cannot make use of Gridsome’s amazing g-image component, because they are created dynamically. g-image only works static or by using GraphQL, so that’s something to think about. Finally, some more providers with real data would be nice to justify the products existence.
Therefore, the next step will be to find and add the provider data.